How to compute and visualize the Standardized Precipitation Index (SPI) for drought analysis. Part I
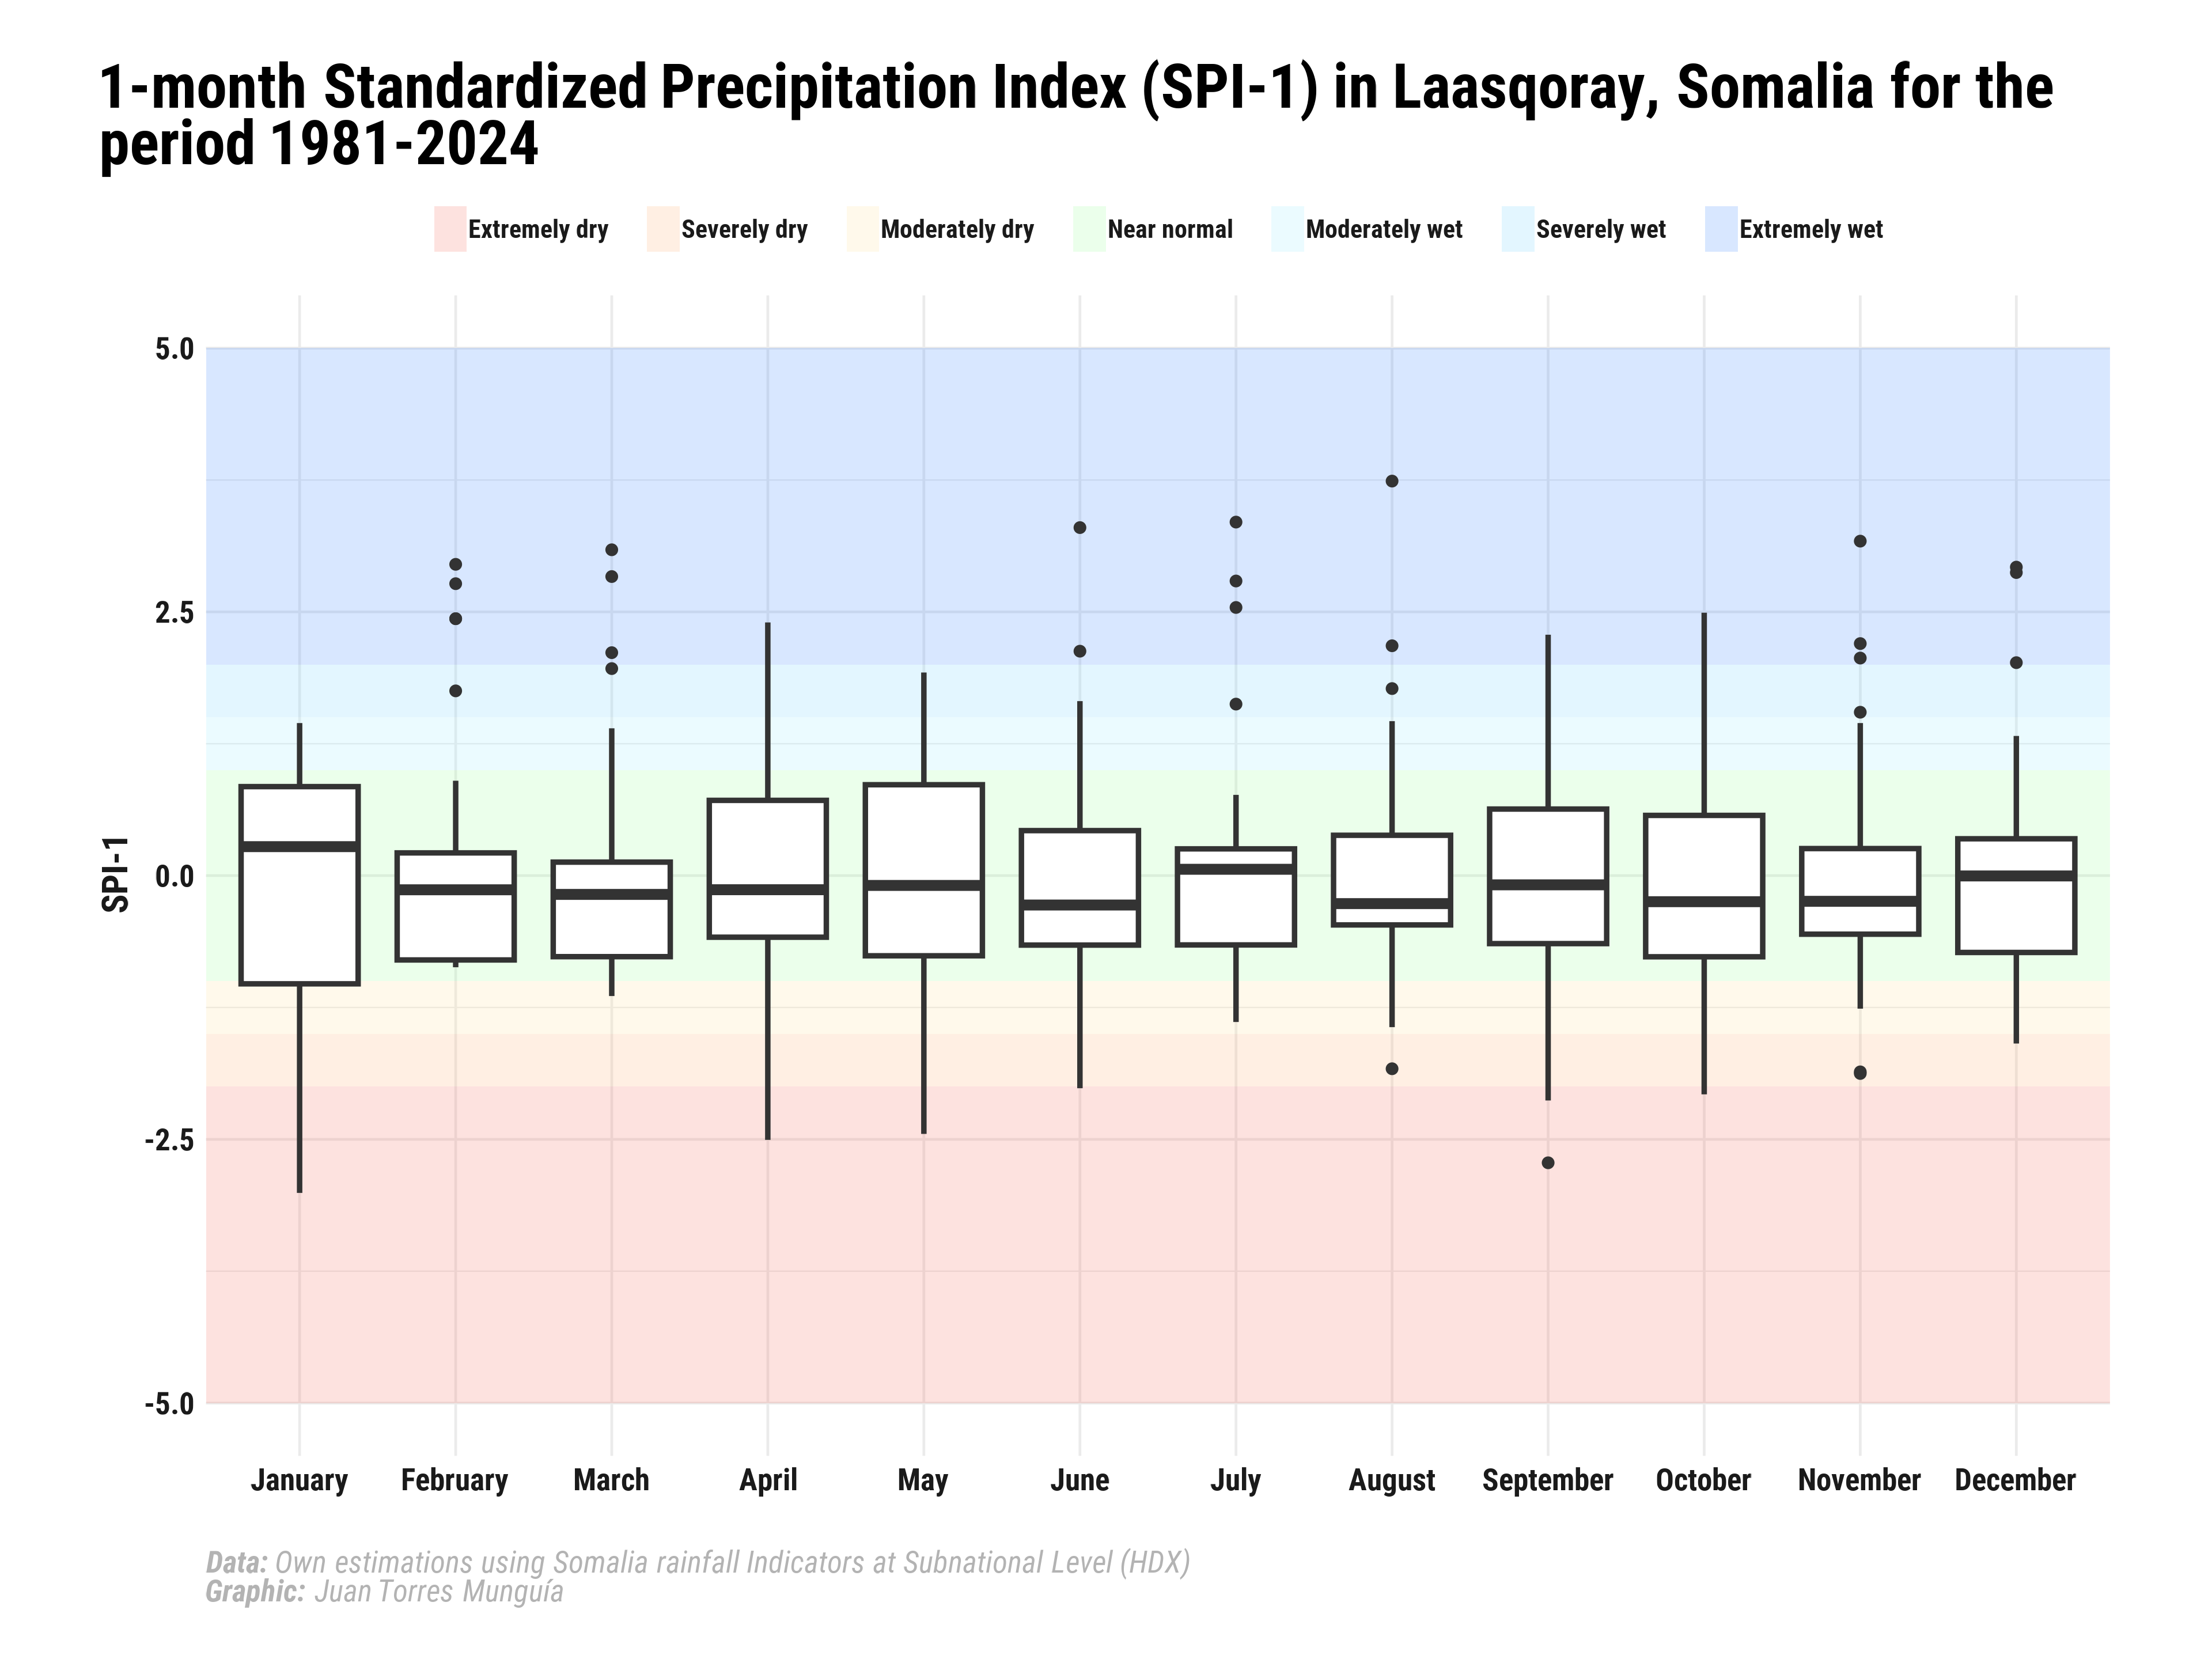
A box plot to visualize the Standardized Precipitation Index (SPI) for drought analysis in Somalia
data visualization
To access the source code and replicate this chart, visit my Blog.
Citation
BibTeX citation:
@online{torres_munguía2025,
  author = {Torres Munguía, Juan Armando},
  title = {How to Compute and Visualize the {Standardized}
    {Precipitation} {Index} {(SPI)} for Drought Analysis. {Part} {I}},
  date = {2025-02-08},
  url = {https://juan-torresmunguia.netlify.app/portfolio/spi_somalia/},
  langid = {en}
}
For attribution, please cite this work as:
Torres Munguía, Juan Armando. 2025. “How to Compute and Visualize
the Standardized Precipitation Index (SPI) for Drought Analysis. Part
I.” February 8, 2025. https://juan-torresmunguia.netlify.app/portfolio/spi_somalia/.