Description
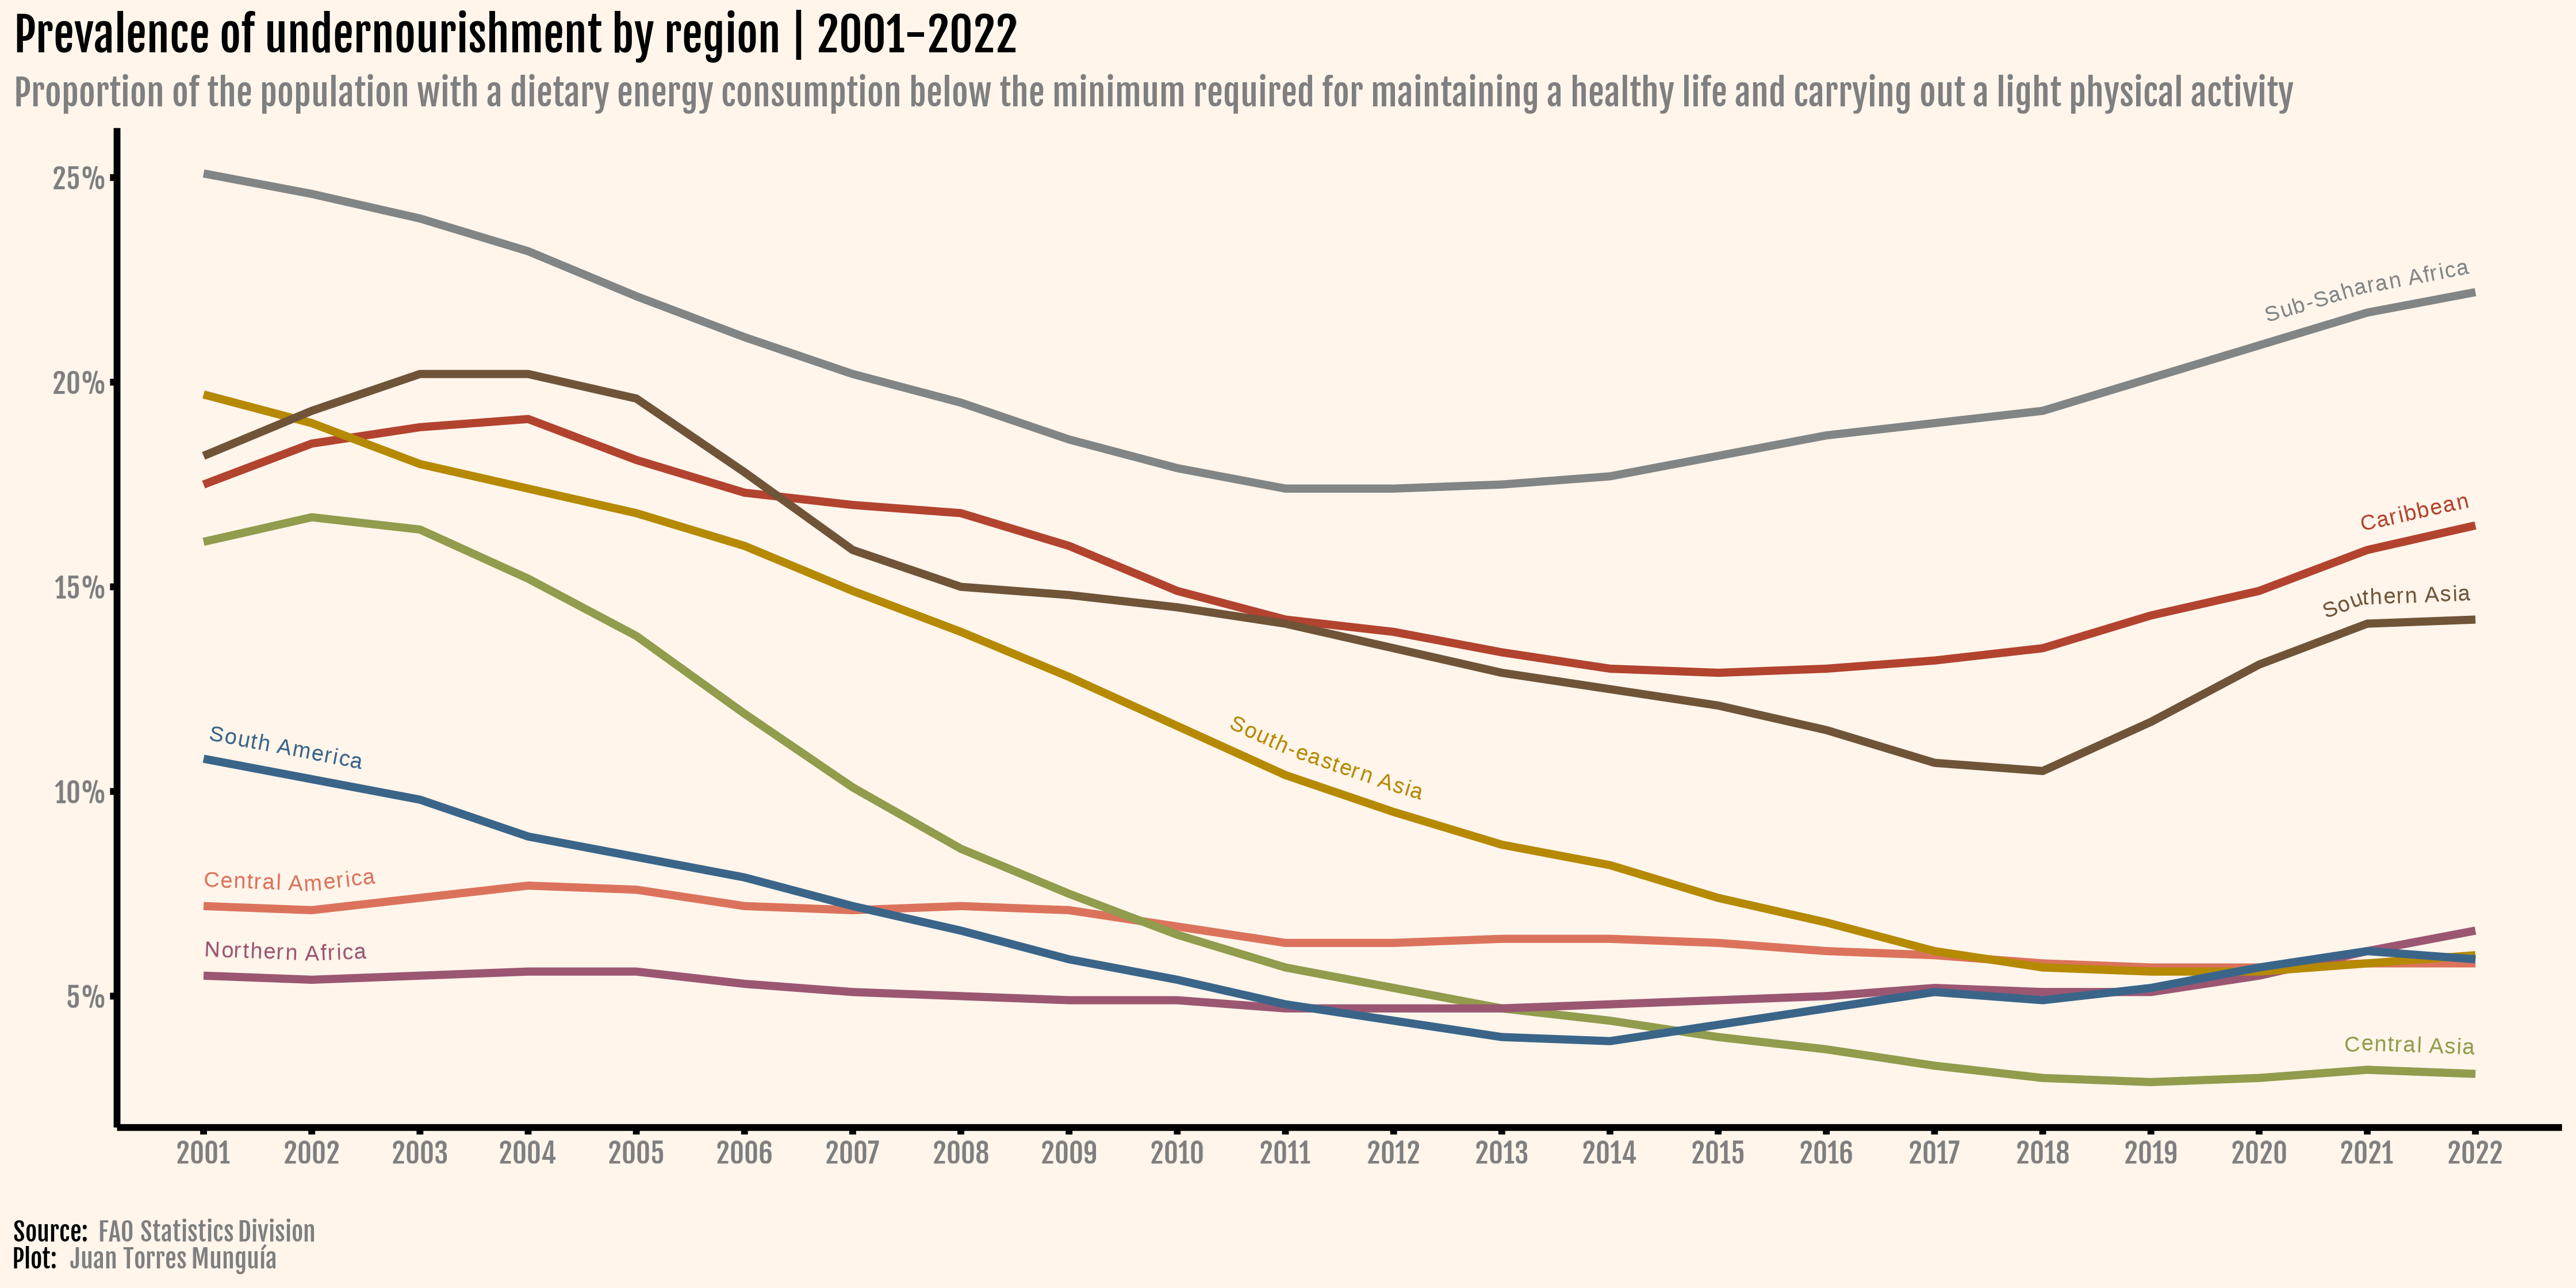
Line charts are used to visualize data points connected by straight lines, typically to show trends over time or continuous data. They are particularly useful for identifying patterns, fluctuations, and overall trends in datasets.
Line charts are used to visualize data points connected by straight lines, typically to show trends over time or continuous data. They are particularly useful for identifying patterns, fluctuations, and overall trends in datasets.