Description
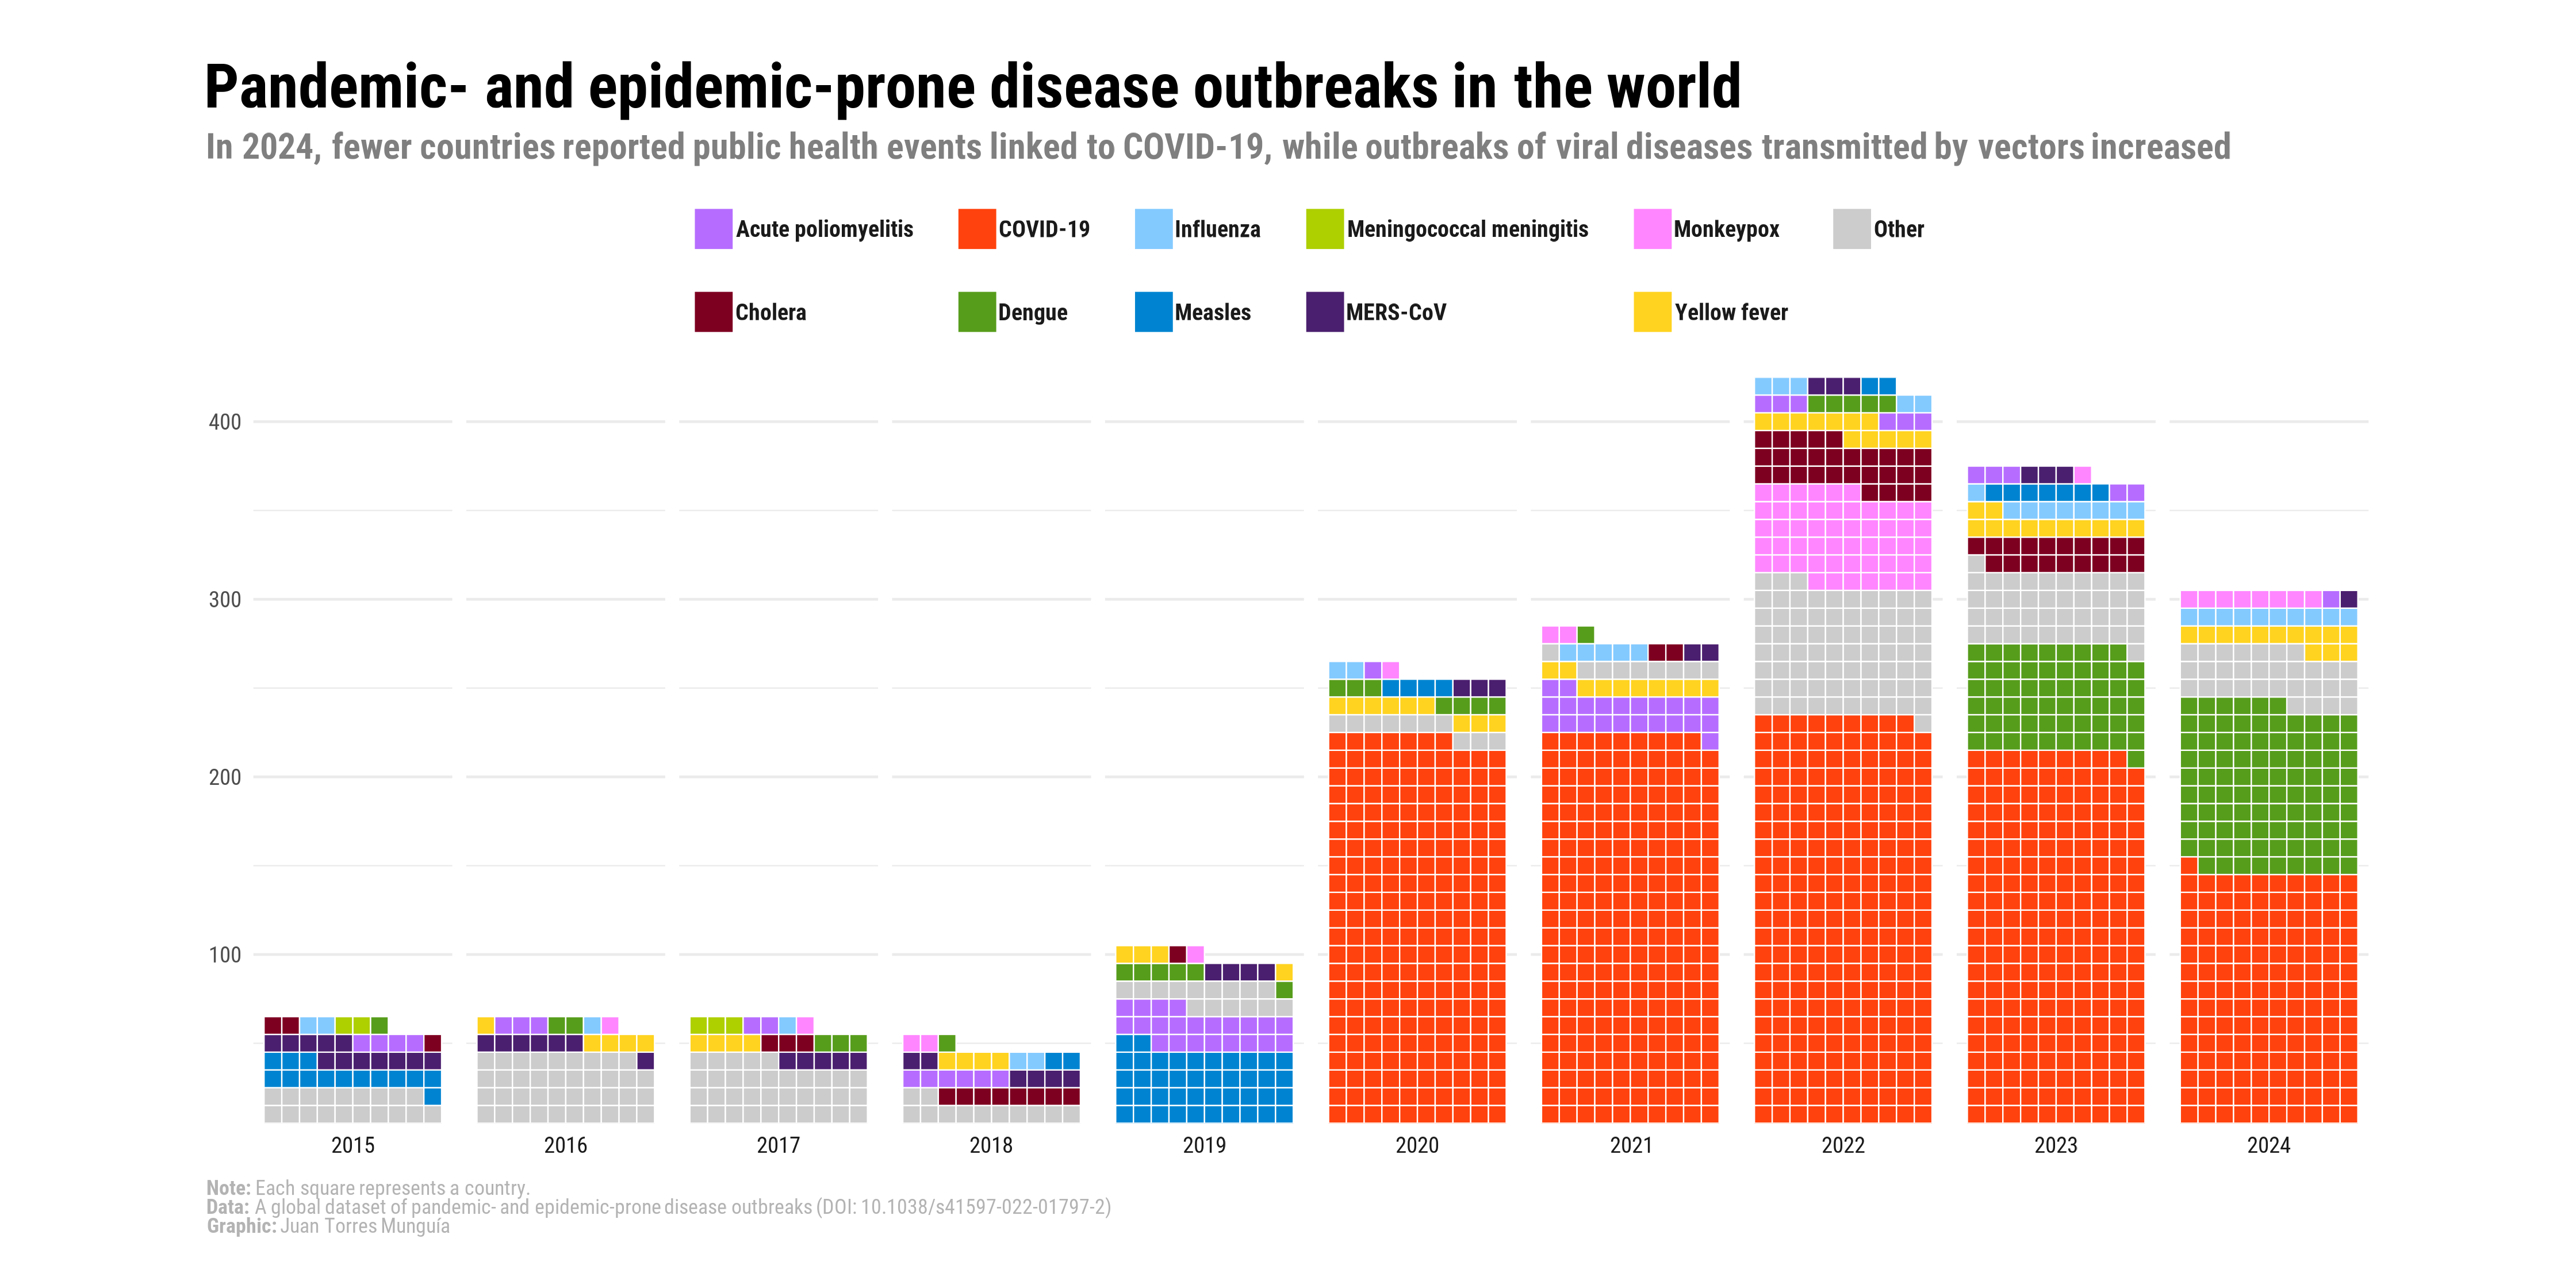
A waffle chart is a grid-based visualization that displays categorical data using squares or rectangles. Each square represents a fixed number of data points, allowing for an easy comparison of proportions across categories. Waffle charts are particularly useful for showing the composition of a whole.