Description
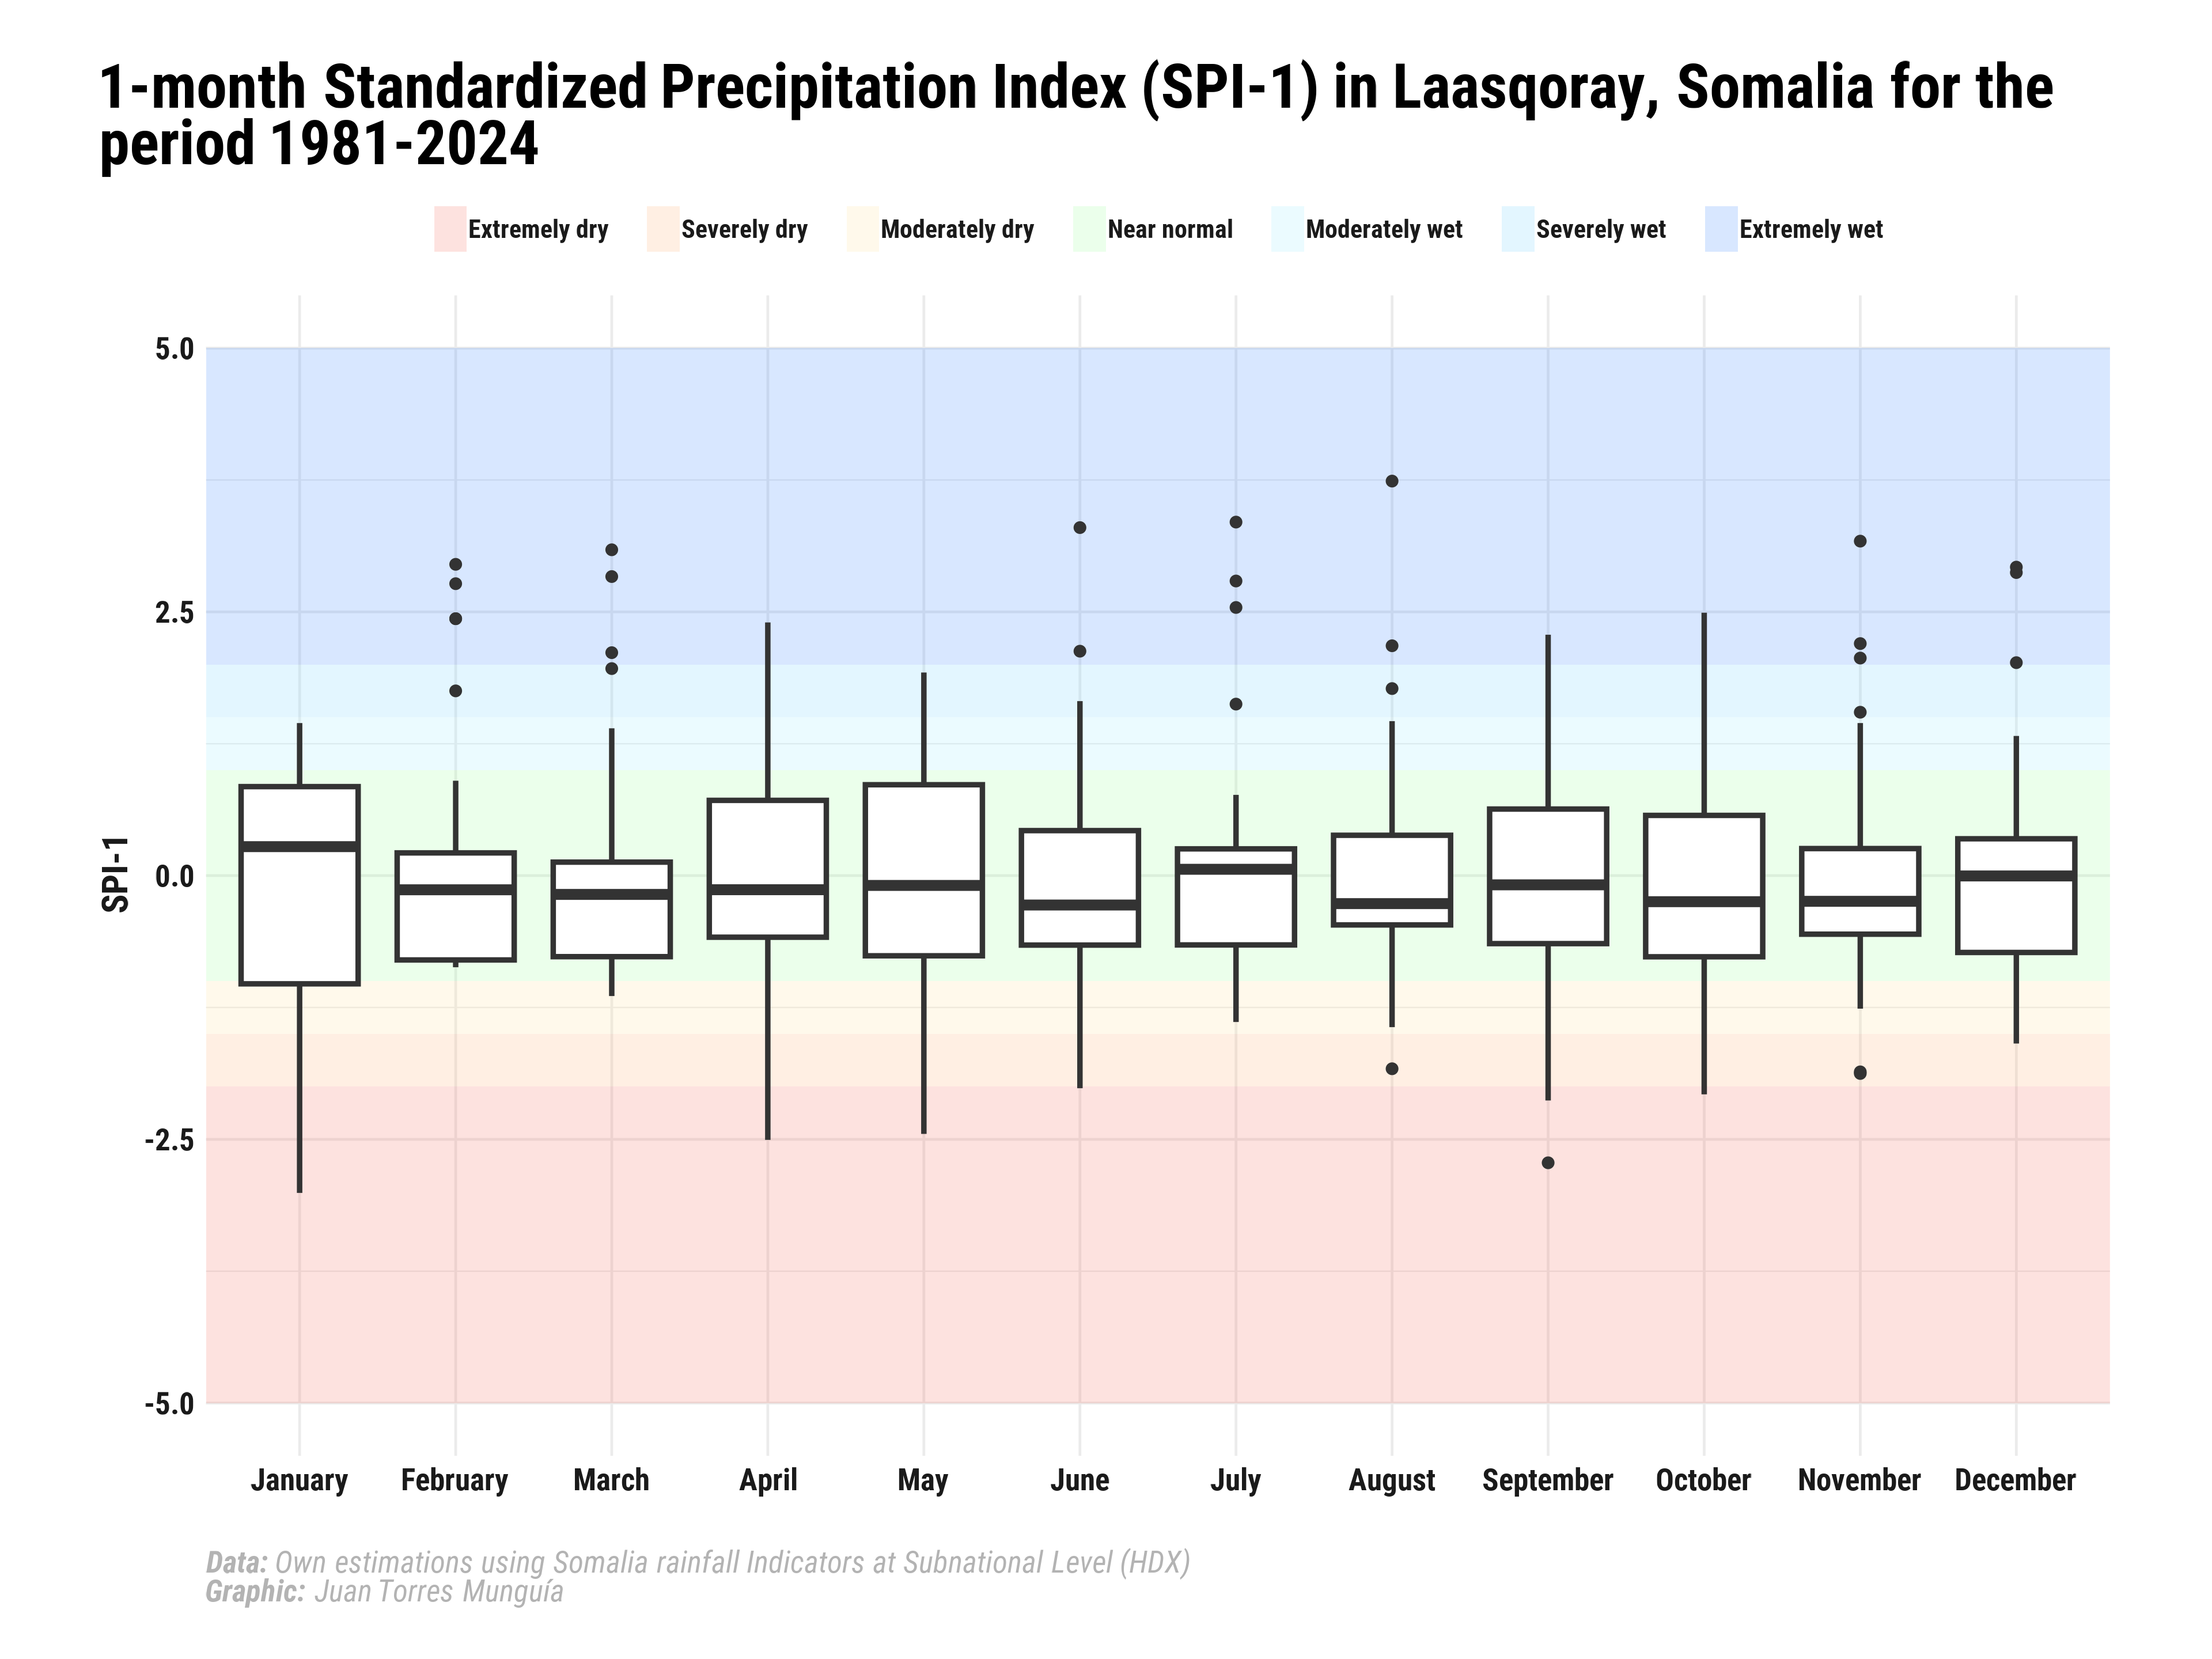
Boxplots are a type of data visualization that summarizes the distribution of a dataset by displaying its minimum, first quartile (Q1), median (Q2), third quartile (Q3), and maximum values. They are particularly useful for identifying outliers and understanding the spread and symmetry of the data.